Analyzing packet traces
Analyzing packet traces
When debugging networking problems or to figure out performance problems, it is sometimes useful to capture the segments that are exchanged between two hosts and to analyze them.
Several packet trace analysis tools are available, either as commercial or open-source tools. These tools are able to capture all the packets exchanged on a link. Of course, capturing packets require administrator privileges. They can also analyze the content of the captured packets and display information about them. The captured packets can be stored in a file for offline analysis.
tcpdump is probably one of the most well known packet capture software. It is able to both capture packets and display their content. tcpdump is a text-based tool that can display the value of the most important fields of the captured packets. Additional information about tcpdump may be found in tcpdump(1).
As an illustration, let us use tcpdump to analyze the packets exchanged while executing the following command on a Linux host:
curl -6 http://www.computer-networking.info
<!DOCTYPE HTML PUBLIC "-//IETF//DTD HTML 2.0//EN">
<html><head>
<title>302 Found</title>
</head><body>
<h1>Found</h1>
<p>The document has moved <a href="https://www.computer-networking.info/">here</a>.</p>
</body></html>
The -6 parameter passed to curl forces the utilization of IPv6. curl returns an HTML page that indicates that https must be used instead of http to access this web site.
A first solution to analyze this trace is to use tcpdump on the command line. The -n disables the reverse DNS lookups that tcpdump does by default for all IP addresses. The -r argument is the name of the file contained the captured packets. The trace starts with the DNS request. This request was sent over IPv4 which is the default on this host. tcpdump indicates the query and the response returned by the local DNS resolver.
tcpdump -n -r simple-trace.pcap
reading from file simple-trace.pcap, link-type LINUX_SLL (Linux cooked)
15:50:39.827908 IP 130.104.229.28.38417 > 130.104.230.68.53: 38133+ AAAA? www.computer-networking.info. (46)
15:50:39.828793 IP 130.104.230.68.53 > 130.104.229.28.38417: 38133 3/4/8 CNAME cnp3book.info.ucl.ac.be., CNAME cnp3.info.ucl.ac.be., AAAA 2001:6a8:308f:8:0:82ff:fe68:e48c (385)
The following three lines of the tcpdump output correspond to TCP’s three-way handshake. There are several interesting points to note in this output. First, Flags [S] indicates that the SYN flag was set in the first and second segments. In this first segment, tcpdump indicates the initial sequence number (2681184541). In the second segment, tcpdump indicates both the initial sequence number (3804204915) and the acknowledgment number (2681184542). Both segments contain TCP options. Starting in the third segment, tcpdump shows relative sequence numbers. Thus, the acknowledgment that you observe in the third segment is an acknowledgment for the SYN returned by the server.
15:50:39.829353 IP6 2001:6a8:308f:9:0:82ff:fe68:e51c.34598 > 2001:6a8:308f:8:0:82ff:fe68:e48c.80: Flags [S], seq 2681184541, win 28800, options [mss 1440,sackOK,TS val 609493767 ecr 0,nop,wscale 7], length 0
15:50:39.830043 IP6 2001:6a8:308f:8:0:82ff:fe68:e48c.80 > 2001:6a8:308f:9:0:82ff:fe68:e51c.34598: Flags [S.], seq 3804204915, ack 2681184542, win 28560, options [mss 1440,sackOK,TS val 1646122290 ecr 609493767,nop,wscale 7], length 0
15:50:39.830074 IP6 2001:6a8:308f:9:0:82ff:fe68:e51c.34598 > 2001:6a8:308f:8:0:82ff:fe68:e48c.80: Flags [.], ack 1, win 225, options [nop,nop,TS val 609493768 ecr 1646122290], length 0
15:50:39.830258 IP6 2001:6a8:308f:9:0:82ff:fe68:e51c.34598 > 2001:6a8:308f:8:0:82ff:fe68:e48c.80: Flags [P.], seq 1:93, ack 1, win 225, options [nop,nop,TS val 609493768 ecr 1646122290], length 92: HTTP: GET / HTTP/1.1
15:50:39.830750 IP6 2001:6a8:308f:8:0:82ff:fe68:e48c.80 > 2001:6a8:308f:9:0:82ff:fe68:e51c.34598: Flags [.], ack 93, win 224, options [nop,nop,TS val 1646122290 ecr 609493768], length 0
The two lines above correspond to the request sent by the client and the acknowledgment returned by the server. Note that the first byte sent by the client has 1 as relative sequence number. In this example, the HTTP request has a total length of 92 bytes. This request is immediately acknowledged by the server.
The server then sends its response, which fits inside a single segment. The client acknowledges the reception of this segment.
15:50:39.841255 IP6 2001:6a8:308f:8:0:82ff:fe68:e48c.80 > 2001:6a8:308f:9:0:82ff:fe68:e51c.34598: Flags [P.], seq 1:458, ack 93, win 224, options [nop,nop,TS val 1646122301 ecr 609493768], length 457: HTTP: HTTP/1.1 302 Found
15:50:39.841270 IP6 2001:6a8:308f:9:0:82ff:fe68:e51c.34598 > 2001:6a8:308f:8:0:82ff:fe68:e48c.80: Flags [.], ack 458, win 234, options [nop,nop,TS val 609493779 ecr 1646122301], length 0
The TCP connection is then closed by exchanging three segments, the first two having the FIN flag set.
15:50:39.843259 IP6 2001:6a8:308f:9:0:82ff:fe68:e51c.34598 > 2001:6a8:308f:8:0:82ff:fe68:e48c.80: Flags [F.], seq 93, ack 458, win 234, options [nop,nop,TS val 609493781 ecr 1646122301], length 0
15:50:39.862246 IP6 2001:6a8:308f:8:0:82ff:fe68:e48c.80 > 2001:6a8:308f:9:0:82ff:fe68:e51c.34598: Flags [F.], seq 458, ack 94, win 224, options [nop,nop,TS val 1646122317 ecr 609493781], length 0
15:50:39.862265 IP6 2001:6a8:308f:9:0:82ff:fe68:e51c.34598 > 2001:6a8:308f:8:0:82ff:fe68:e48c.80: Flags [.], ack 459, win 234, options [nop,nop,TS val 609493800 ecr 1646122317], length 0
tcpdump can provide more detailed information about the packets by using the -v or -vv option.
wireshark is more recent than tcpdump. It evolved from the ethereal packet trace analysis software. It can be used as a text tool like tcpdump. For a TCP connection, wireshark can provide almost the same output as tcpdump. The main advantage of wireshark is that it also includes a graphical user interface that allows performing various types of analysis on a packet trace.
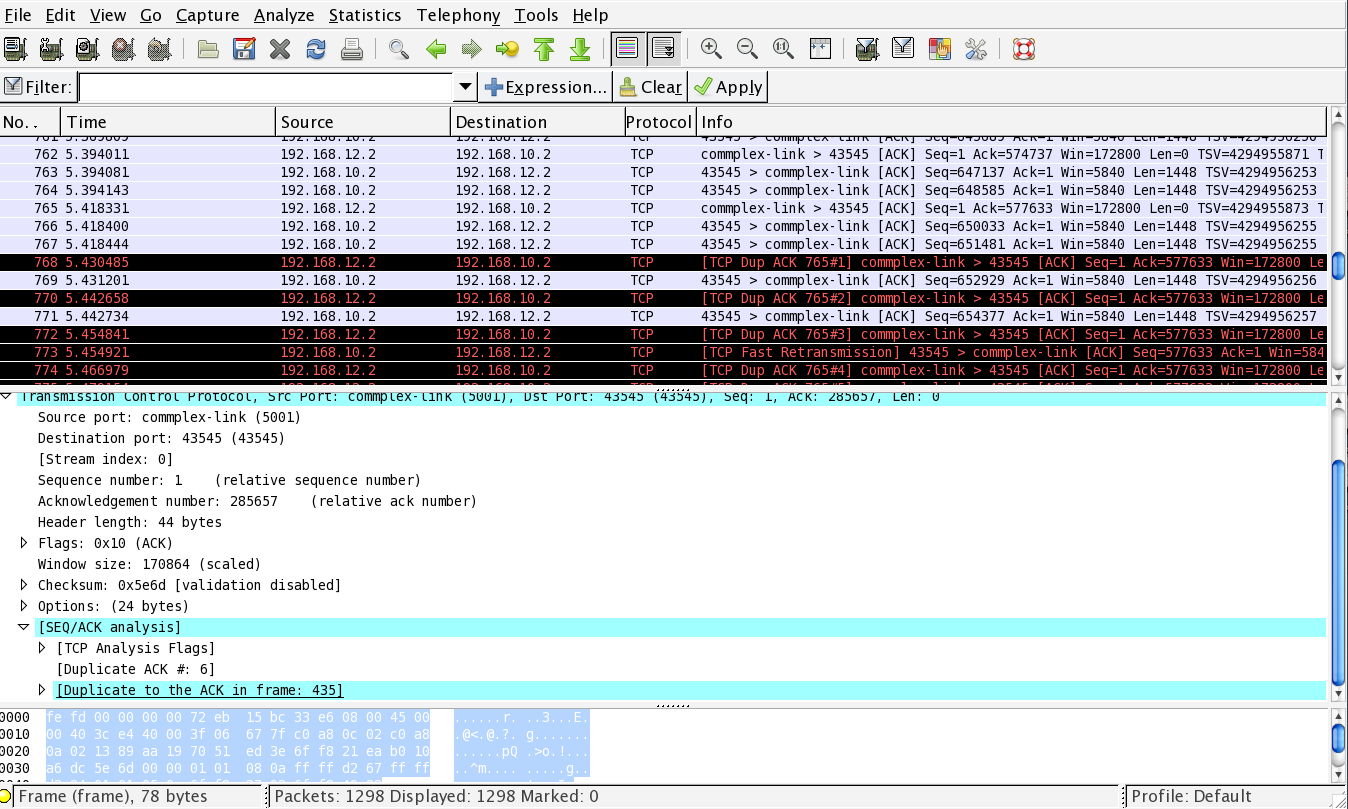
Wireshark : default window
The wireshark window is divided in three parts. The top part of the window is a summary of the first packets from the trace. By clicking on one of the lines, you can show the detailed content of this packet in the middle part of the window. The middle of the window allows you to inspect all the fields of the captured packet. The bottom part of the window is the hexadecimal representation of the packet, with the field selected in the middle window being highlighted.
wireshark is very good at displaying packets, but it also contains several analysis tools that can be very useful. The first tool is Follow TCP stream. It is part of the Analyze menu and allows you to reassemble and display all the payload exchanged during a TCP connection. This tool can be useful if you need to analyze for example the commands exchanged during an HTTP or SMTP session.
The second tool is the flow graph that is part of the Statistics menu. It provides a time sequence diagram of the packets exchanged with some comments about the packet contents. See below for an example.
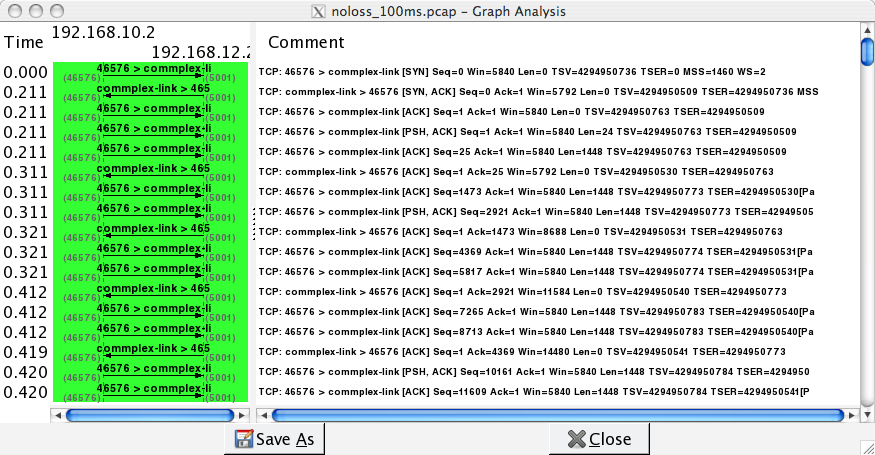
Wireshark : flow graph
Use wireshark to analyze the packet traces described earlier traces/simple-trace.pcap.
When analyzing packet traces with wireshark, it is often very useful to use Display filters that only show the packets that match some specific criteria. These filters are described in several online documents:
the wireshark wiki page on Display filters
a nice tutorial on Wireshark Display Filters by Brad Duncan
You can now use your understanding of wireshark and tcpdump to analyze a 2-minutes long packet trace.